Solar Self-Consumption vs Self-Sufficiency Explained
These two solar percentages answer different questions. Learn how to read them in a quote, calculator or monitoring app without mixing them up.
 Randy Osifo-Doe
Solar self consumption vs self sufficiency sounds like two ways of saying the same thing, but the percentages answer different questions. Self-consumption looks at the solar electricity your system generates. Self-sufficiency looks at all the electricity your home uses.
That difference matters when you compare quotes, read a calculator or open a monitoring app. A household can have a high result for one measure and a modest result for the other without anything being wrong.
The two questions in plain English
The Australian Government's solar glossary defines solar self-consumption as solar electricity used within your property. It defines self-sufficiency as the proportion of your home's electricity use supplied by its solar and battery system.
For a clear comparison, read the percentages this way:
| Measure | The question it answers | The starting total |
|---|---|---|
| Self-consumption | How much of the solar we generated did we use at home? | Total solar generation |
| Self-sufficiency | How much of the electricity we used came from our solar and battery system? | Total household electricity use |
The denominator changes. That is why the two results should not be compared as though they are the same score.
A simple example
Imagine a home generates 20 kWh of solar electricity in one day. It uses 8 kWh of that solar while it is available and exports the remaining 12 kWh.
Its solar self-consumption for that day is 40%: 8 kWh used at the property divided by 20 kWh generated.
Now imagine the home uses 16 kWh of electricity across the full day. If 8 kWh came directly from solar and the other 8 kWh came from the grid, its self-sufficiency is 50%: 8 kWh supplied by solar divided by 16 kWh used.
These are illustrative figures, not a performance target. Weather, season, system size and the timing of household use can all change the daily result.
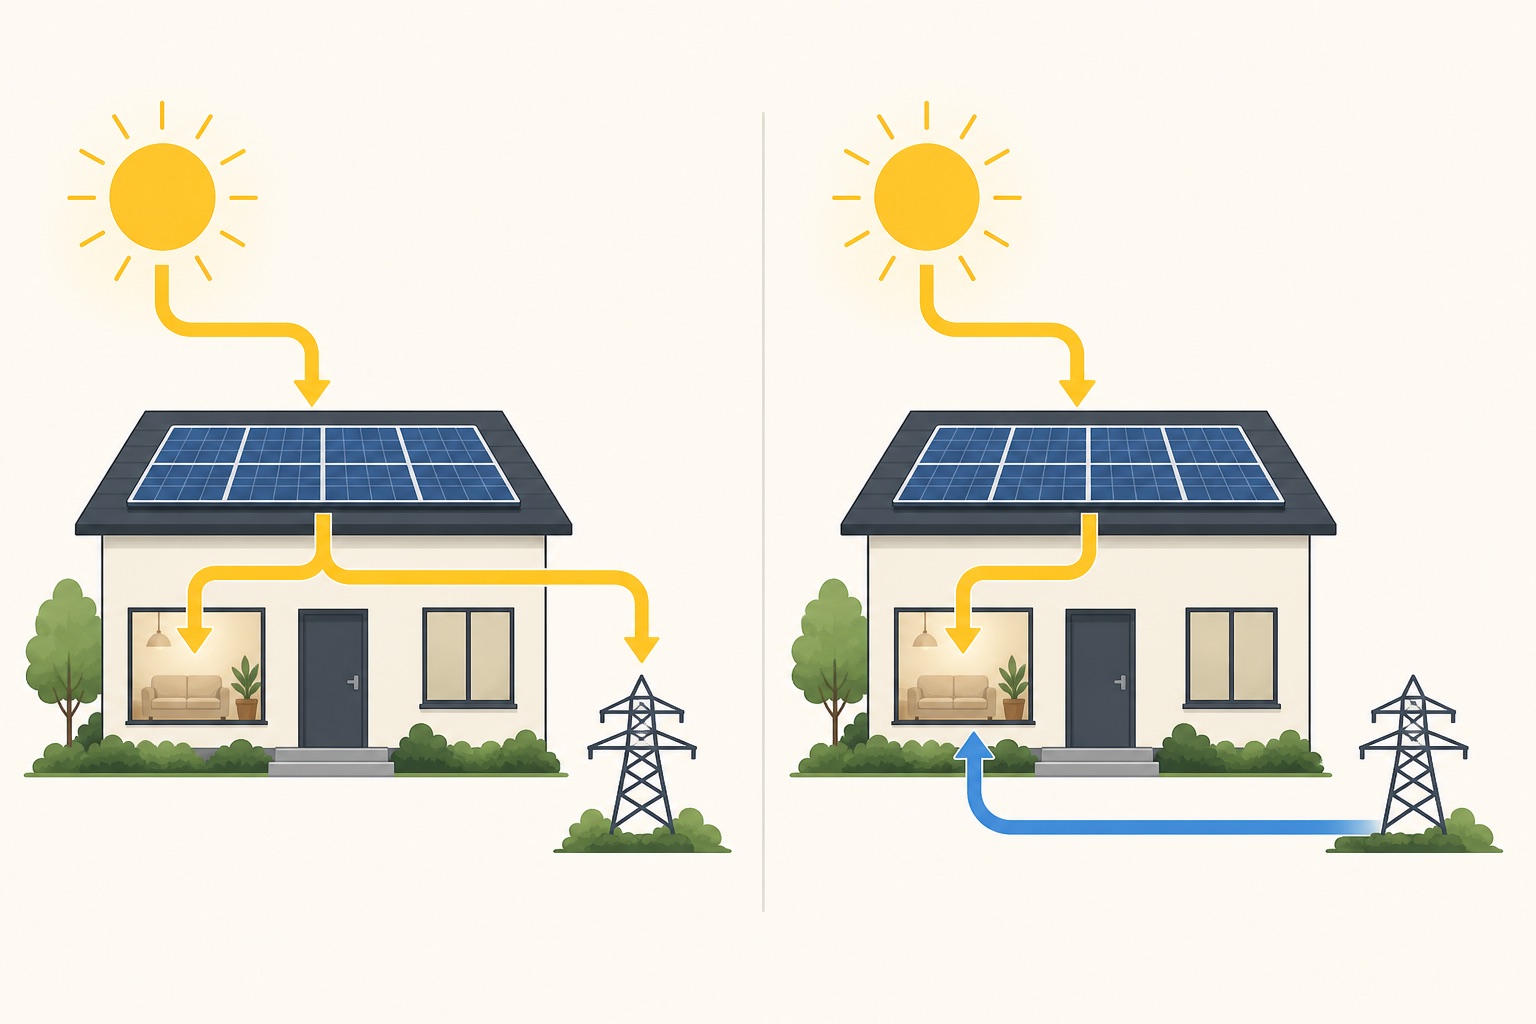
On the left, the starting total is solar generation. On the right, the starting total is household electricity use.
A high percentage is not the whole story
A small solar system may have high self-consumption because the home uses nearly everything it generates, yet it may still supply only a small share of the home's total electricity use. That means high self-consumption can sit beside lower self-sufficiency.
A larger system may export more during sunny hours, which can lower its self-consumption percentage. At the same time, it may cover more of the home's total use and produce higher self-sufficiency. Neither percentage alone tells you whether the system is well sized for the property.
A battery can store excess solar for later, which may increase both measures. It still needs to suit the home's load pattern. The battery sizing guide explains why capacity should be assessed against when electricity is used, not just the daily total.
Check what your app is measuring
Monitoring platforms do not always use identical labels or time periods. Before relying on a percentage, check:
- whether the app measures household electricity use as well as solar generation
- whether the result covers a day, month or year
- whether battery charging from the grid is treated separately from stored solar
- whether missing meter or internet data creates gaps
- whether you are comparing the same season and date range.
Start with the solar monitoring app guide, and use the kW versus kWh guide if the power and energy figures are getting mixed together.
The Australian Government's guidance on getting more from solar recommends using appliances while the system is generating and checking monitoring data to understand the best times for your home. The practical aim is not to chase a perfect percentage. It is to understand where your solar goes and which changes genuinely fit your routine.
What to ask when comparing a quote
If a quote includes either percentage, ask the retailer to show:
- the annual household electricity use assumed
- the estimated annual solar generation
- how much solar is expected to be used at the property
- how much is expected to be exported or stored
- whether a battery is included in the calculation
- which usage data and time period support the estimate.
You can explore the relationship with the solar calculator, then compare its assumptions with your bills and interval data. For practical load shifting, the daytime appliance guide shows how timing changes the share of solar used at home.
The calm next step is to keep both percentages, their denominators and their assumptions together. Once those are clear, the numbers become useful instead of competing claims.
Sources checked
Last reviewed August 2026
This guide is reviewed against current Australian solar policy and market guidance where available. Confirm retailer prices, rebates, and product eligibility before making a purchase decision.
Randy Osifo-Doe is the Brisbane-based founder and lead writer of Aussie Solar Guide. His background is in finance, banking and household budgeting, and he writes from lived experience as a solar homeowner. He is not presented as an engineer, electrician, solar installer or renewable-energy professional.